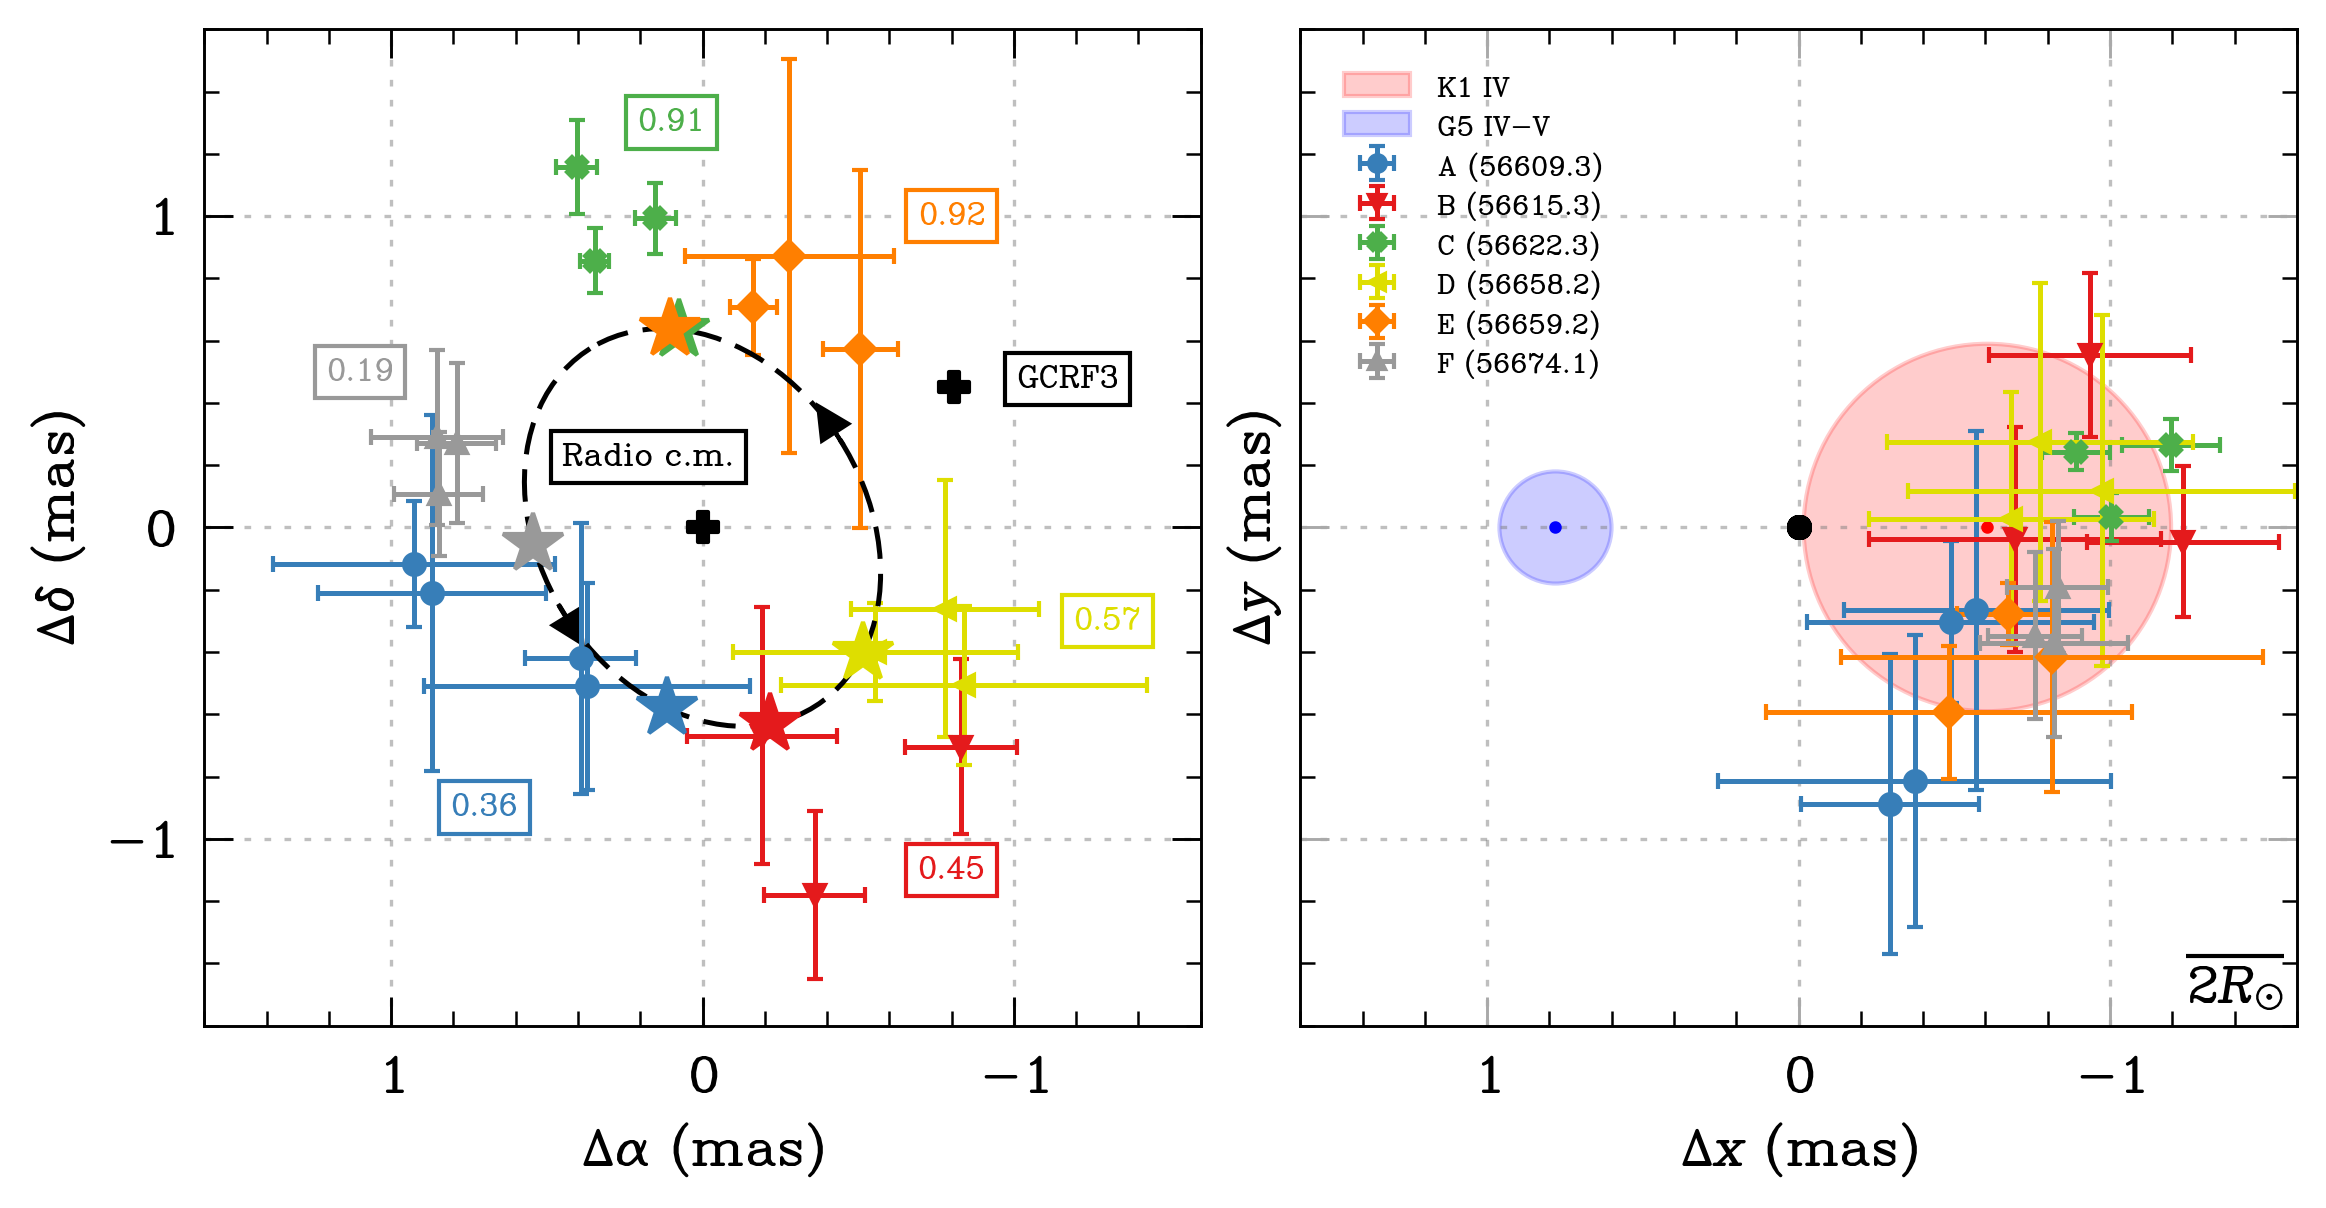
epoch_orbit_phases = []
for i, epoch in enumerate(epochs):
    epoch_orbit_phases.append(hr1099.orbit_phase(mean_jd[i]))
sorted_index = np.argsort(epoch_orbit_phases)

fig, ax = plt.subplots(1, 2, figsize=(9, 5), sharex=True, sharey=True)
fig.subplots_adjust(wspace=0.1)

for i, epoch in enumerate(epochs):
    ax[0].errorbar(
        target_results[epoch][0] + med_val[0],
        target_results[epoch][1] + med_val[1],
        xerr=target_results[epoch][3],
        yerr=target_results[epoch][4],
        marker=marker_cycle[i],
        markersize=5,
        linestyle="None",
        color=cm[i],
        label="%s (%.1f)" % (epoch, mean_jd[i]),
    )

    ra1, dec1, ra2, dec2, rho1, rho2, phi = hr1099.binary_offsets(mean_jd[i])
    ax[0].plot(
        [ra1 / mas], [dec1 / mas], markersize=15, marker="*", color=cm[i], zorder=3
    )

ax[0].annotate(
    "%.2f" % epoch_orbit_phases[0],
    xy=(0.7, -0.9),
    fontsize=9,
    bbox={"boxstyle": "square", "facecolor": "white", "edgecolor": cm[0]},
    color=cm[0],
    horizontalalignment="center",
    verticalalignment="center",
)
ax[0].annotate(
    "%.2f" % epoch_orbit_phases[1],
    xy=(-0.8, -1.1),
    fontsize=9,
    bbox={"boxstyle": "square", "facecolor": "white", "edgecolor": cm[1]},
    color=cm[1],
    horizontalalignment="center",
    verticalalignment="center",
)
ax[0].annotate(
    "%.2f" % epoch_orbit_phases[2],
    xy=(0.1, 1.3),
    fontsize=9,
    bbox={"boxstyle": "square", "facecolor": "white", "edgecolor": cm[2]},
    color=cm[2],
    horizontalalignment="center",
    verticalalignment="center",
)
ax[0].annotate(
    "%.2f" % epoch_orbit_phases[3],
    xy=(-1.3, -0.3),
    fontsize=9,
    bbox={"boxstyle": "square", "facecolor": "white", "edgecolor": cm[3]},
    color=cm[3],
    horizontalalignment="center",
    verticalalignment="center",
)
ax[0].annotate(
    "%.2f" % epoch_orbit_phases[4],
    xy=(-0.8, 1),
    fontsize=9,
    bbox={"boxstyle": "square", "facecolor": "white", "edgecolor": cm[4]},
    color=cm[4],
    horizontalalignment="center",
    verticalalignment="center",
)
ax[0].annotate(
    "%.2f" % epoch_orbit_phases[5],
    xy=(1.1, 0.5),
    fontsize=9,
    bbox={"boxstyle": "square", "facecolor": "white", "edgecolor": cm[5]},
    color=cm[5],
    horizontalalignment="center",
    verticalalignment="center",
)

orbit_range = np.linspace(T, T + P / 60 / 60 / 24, 100)
orbit_x = []
orbit_y = []
for t in orbit_range:
    ra1, dec1, ra2, dec2, rho1, rho2, phi = hr1099.binary_offsets(t)
    orbit_x.append(ra1 / mas)
    orbit_y.append(dec1 / mas)

ax[0].plot(orbit_x, orbit_y, color="black", linestyle="--")
ax[0].arrow(
    orbit_x[24],
    orbit_y[24],
    orbit_x[25] - orbit_x[24],
    orbit_y[25] - orbit_y[24],
    head_width=0.1,
    head_length=0.1,
    fc="black",
    ec="black",
)
ax[0].arrow(
    orbit_x[74],
    orbit_y[74],
    orbit_x[75] - orbit_x[74],
    orbit_y[75] - orbit_y[74],
    head_width=0.1,
    head_length=0.1,
    fc="black",
    ec="black",
)

ax[0].scatter([0], [0], marker="P", color="black", zorder=2, s=50)
ax[0].annotate(
    "Radio c.m.",
    xy=(0.45, 0.2),
    fontsize=9,
    bbox={"boxstyle": "square", "facecolor": "white", "edgecolor": "black"},
    zorder=2,
)
ax[0].scatter([med_val[0]], [med_val[1]], marker="P", color="black", zorder=2, s=50)
ax[0].annotate(
    "GCRF3",
    xy=(med_val[0] - 0.2, med_val[1]),
    xycoords="data",
    fontsize=9,
    bbox={"boxstyle": "square", "facecolor": "white", "edgecolor": "black"},
    zorder=2,
)

ax[0].set_xlim(1.6, -1.6)
ax[0].set_ylim(-1.6, 1.6)
ax[0].xaxis.set_major_locator(mpl.ticker.MultipleLocator(1))
ax[0].yaxis.set_major_locator(mpl.ticker.MultipleLocator(1))
ax[0].set_xlabel(r"$\Delta \alpha$ (mas)")
ax[0].set_ylabel(r"$\Delta \delta$ (mas)")
ax[0].grid(True, linestyle="dotted", alpha=0.5)
ax[0].set_aspect("equal")

utils.plot_binary(
    ax[1], hr1099, T + 0.375 * P / 60 / 60 / 24, corotate=True, plot_stars=True, d=d
)

all_epochs = np.concatenate(
    [[epoch] * len(target_results[epoch][0]) for epoch in epochs]
)
all_x = np.concatenate([target_results[epoch][0] for epoch in epochs])
all_y = np.concatenate([target_results[epoch][1] for epoch in epochs])
all_jd = np.concatenate([target_results[epoch][2] for epoch in epochs])
all_x_err = np.concatenate([target_results[epoch][3] for epoch in epochs])
all_y_err = np.concatenate([target_results[epoch][4] for epoch in epochs])

for i, epoch in enumerate(all_epochs):
    utils.plot_binary(
        ax[1],
        hr1099,
        mean_jd[epochs.index(epoch)],
        corotate=True,
        plot_stars=False,
        centroid=[
            all_x[i] + med_val[0],
            all_y[i] + med_val[1],
            all_x_err[i],
            all_y_err[i],
        ],
        label="%s (%.1f)" % (epoch, mean_mjd[epochs.index(epoch)]),
        color=cm[epochs.index(epoch)],
        mapsize=4,
        marker=marker_cycle[epochs.index(epoch)],
    )
ax[1].set_xlabel(r"$\Delta x$ (mas)")
ax[1].set_ylabel(r"$\Delta y$ (mas)")
ax[1].set_xlim(1.6, -1.6)
ax[1].set_ylim(-1.6, 1.6)
ax[1].grid(True, linestyle="dotted", alpha=0.5)
ax[1].set_aspect("equal")

handles, labels = plt.gca().get_legend_handles_labels()
by_label = dict(zip(labels, handles))
ax[1].legend(
    by_label.values(), by_label.keys(), loc="upper left", fontsize=8, markerscale=0.8
)

fig.set_facecolor("white")
fig.set_dpi(300)
fig.savefig(fig_path + "HR1099_positions.pdf", bbox_inches="tight")
plt.show()

