fig, ax = plt.subplots(2, 1, figsize=(7, 5), sharex=True, sharey=True)
fig.subplots_adjust(hspace=0)
orbit_range = np.linspace(HR1099_astrometry.T, HR1099_astrometry.T + HR1099_astrometry.P / 60 / 60 / 24, 100)
orbital_phase = np.array([hr1099.orbit_phase(t) for t in orbit_range])
ra = []; ra_sec = []
dec = []; dec_sec = []
for t in orbit_range:
ra1, dec1, ra2, dec2, rho1, rho2, phi = hr1099.binary_offsets(t)
ra.append(ra1)
dec.append(dec1)
ra_sec.append(ra2)
dec_sec.append(dec2)
ra = np.array(ra)
dec = np.array(dec)
ra_sec = np.array(ra_sec)
dec_sec = np.array(dec_sec)
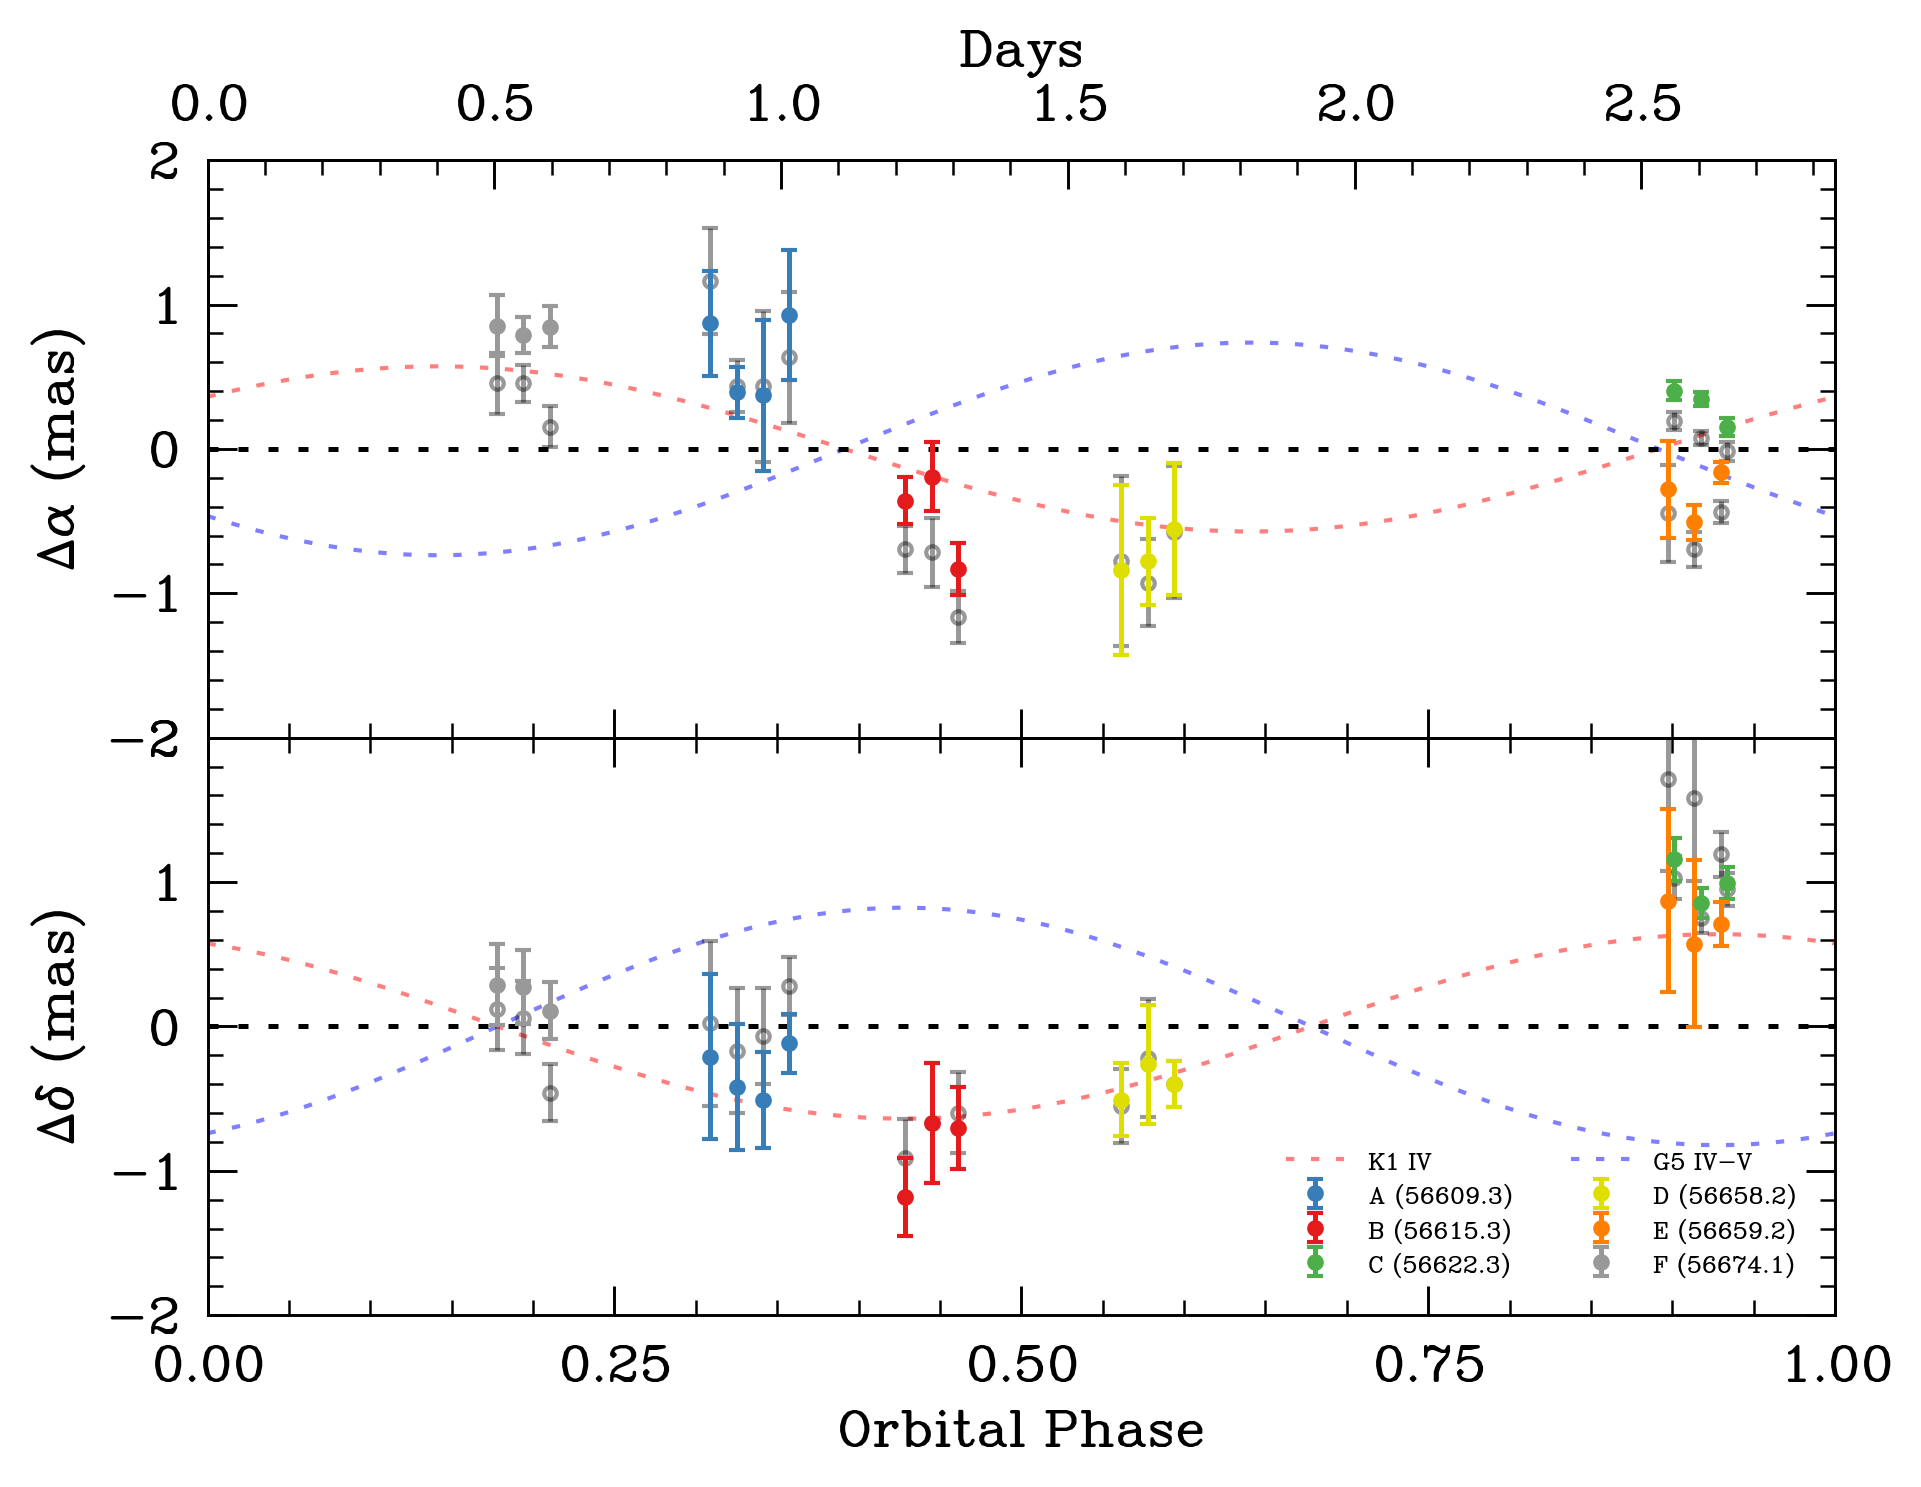
ax[0].plot(orbital_phase, ra/mas, color='red', label="K1 IV", linewidth=1, linestyle="dotted", alpha=0.5)
ax[1].plot(orbital_phase, dec/mas, color='red', linewidth=1, linestyle="dotted", alpha=0.5)
for i, epoch in enumerate(epochs):
jd, x, y, x_err, y_err = target_results[epoch]
cal_jd, cal_x, cal_y, cal_x_err, cal_y_err = calibrator_results[epoch]
phs = np.array([hr1099.orbit_phase(time) for time in jd])
ax[0].errorbar(phs, x + med_val[0], yerr=x_err, fmt="o", color=cm[i], markersize=3, zorder=10, label="%s (%.1f)" % (epoch, mean_mjd[epochs.index(epoch)]))
ax[1].errorbar(phs, y + med_val[1], yerr=y_err, fmt="o", color=cm[i], markersize=3, zorder=10)
ax[0].errorbar(phs, x + med_val[0] - 2.1*cal_x, yerr=x_err, color="black", markersize=3, zorder=9, alpha=0.4,
markerfacecolor="none", markeredgecolor="black", linestyle="none", marker="o")
ax[1].errorbar(phs, y + med_val[1] - 2.1*cal_y, yerr=y_err, color="black", markersize=3, zorder=9, alpha=0.4,
markerfacecolor="none", markeredgecolor="black", linestyle="none", marker="o")
ax[0].plot(orbital_phase, ra_sec/mas, color='blue', label="G5 IV-V", linewidth=1, linestyle="dotted", alpha=0.5)
ax[1].plot(orbital_phase, dec_sec/mas, color='blue', linewidth=1, linestyle="dotted", alpha=0.5)
ax[0].axhline(0, color="black", linestyle="dotted")
ax[1].axhline(0, color="black", linestyle="dotted")
ax[0].set_xlim(0, 1)
ax[0].set_ylim(-2, 2)
ax[0].set_ylabel(r"$\Delta\alpha$ (mas)")
ax[0].xaxis.set_major_locator(plt.MultipleLocator(0.25))
ax[0].xaxis.set_minor_locator(plt.MultipleLocator(0.05))
ax[1].set_xlabel("Orbital Phase")
ax[1].set_ylabel(r"$\Delta\delta$ (mas)")
axz = ax[0].twiny()
axz.set_xlim(0, HR1099_astrometry.P / 60 / 60 / 24)
axz.set_xlabel("Days")
handles, labels = ax[0].get_legend_handles_labels()
order = [0, 2, 3, 4, 1, 5, 6, 7]
ax[1].legend([handles[i] for i in order], [labels[i] for i in order], loc="lower right", ncol=2, fontsize=7)
fig.set_facecolor("white")
fig.set_dpi(300)
fig.savefig(fig_path + "tropospheric_correction.pdf", bbox_inches="tight")
plt.show()