def gauss2d(x, y, sigmax, sigmay):
    return np.exp(-0.5 * (x**2 / sigmax**2 + y**2 / sigmay**2))


cmap = mpl.cm.Reds

fig, ax = plt.subplots(3, 2, figsize=(7, 9), sharex=True, sharey=True)
fig.subplots_adjust(hspace=0.2, wspace=-0.2)

for i, epoch in enumerate(epochs):
    sampler = emcee.backends.HDFBackend(
        data_path + epochs[i] + "_" + target + "_velocity_chain.h5"
    )
    samples = sampler.get_chain(flat=True)

    samples[:, 0] = d * (samples[:, 0] * mas) / (24 * 60 * 60) / 1e3  # mas/day -> km/s
    samples[:, 2] = d * (samples[:, 2] * mas) / (24 * 60 * 60) / 1e3  # mas/day -> km/s
    x = samples[:, 0]
    y = samples[:, 2]

    x_per = np.percentile(x, [16, 50, 84])
    y_per = np.percentile(y, [16, 50, 84])

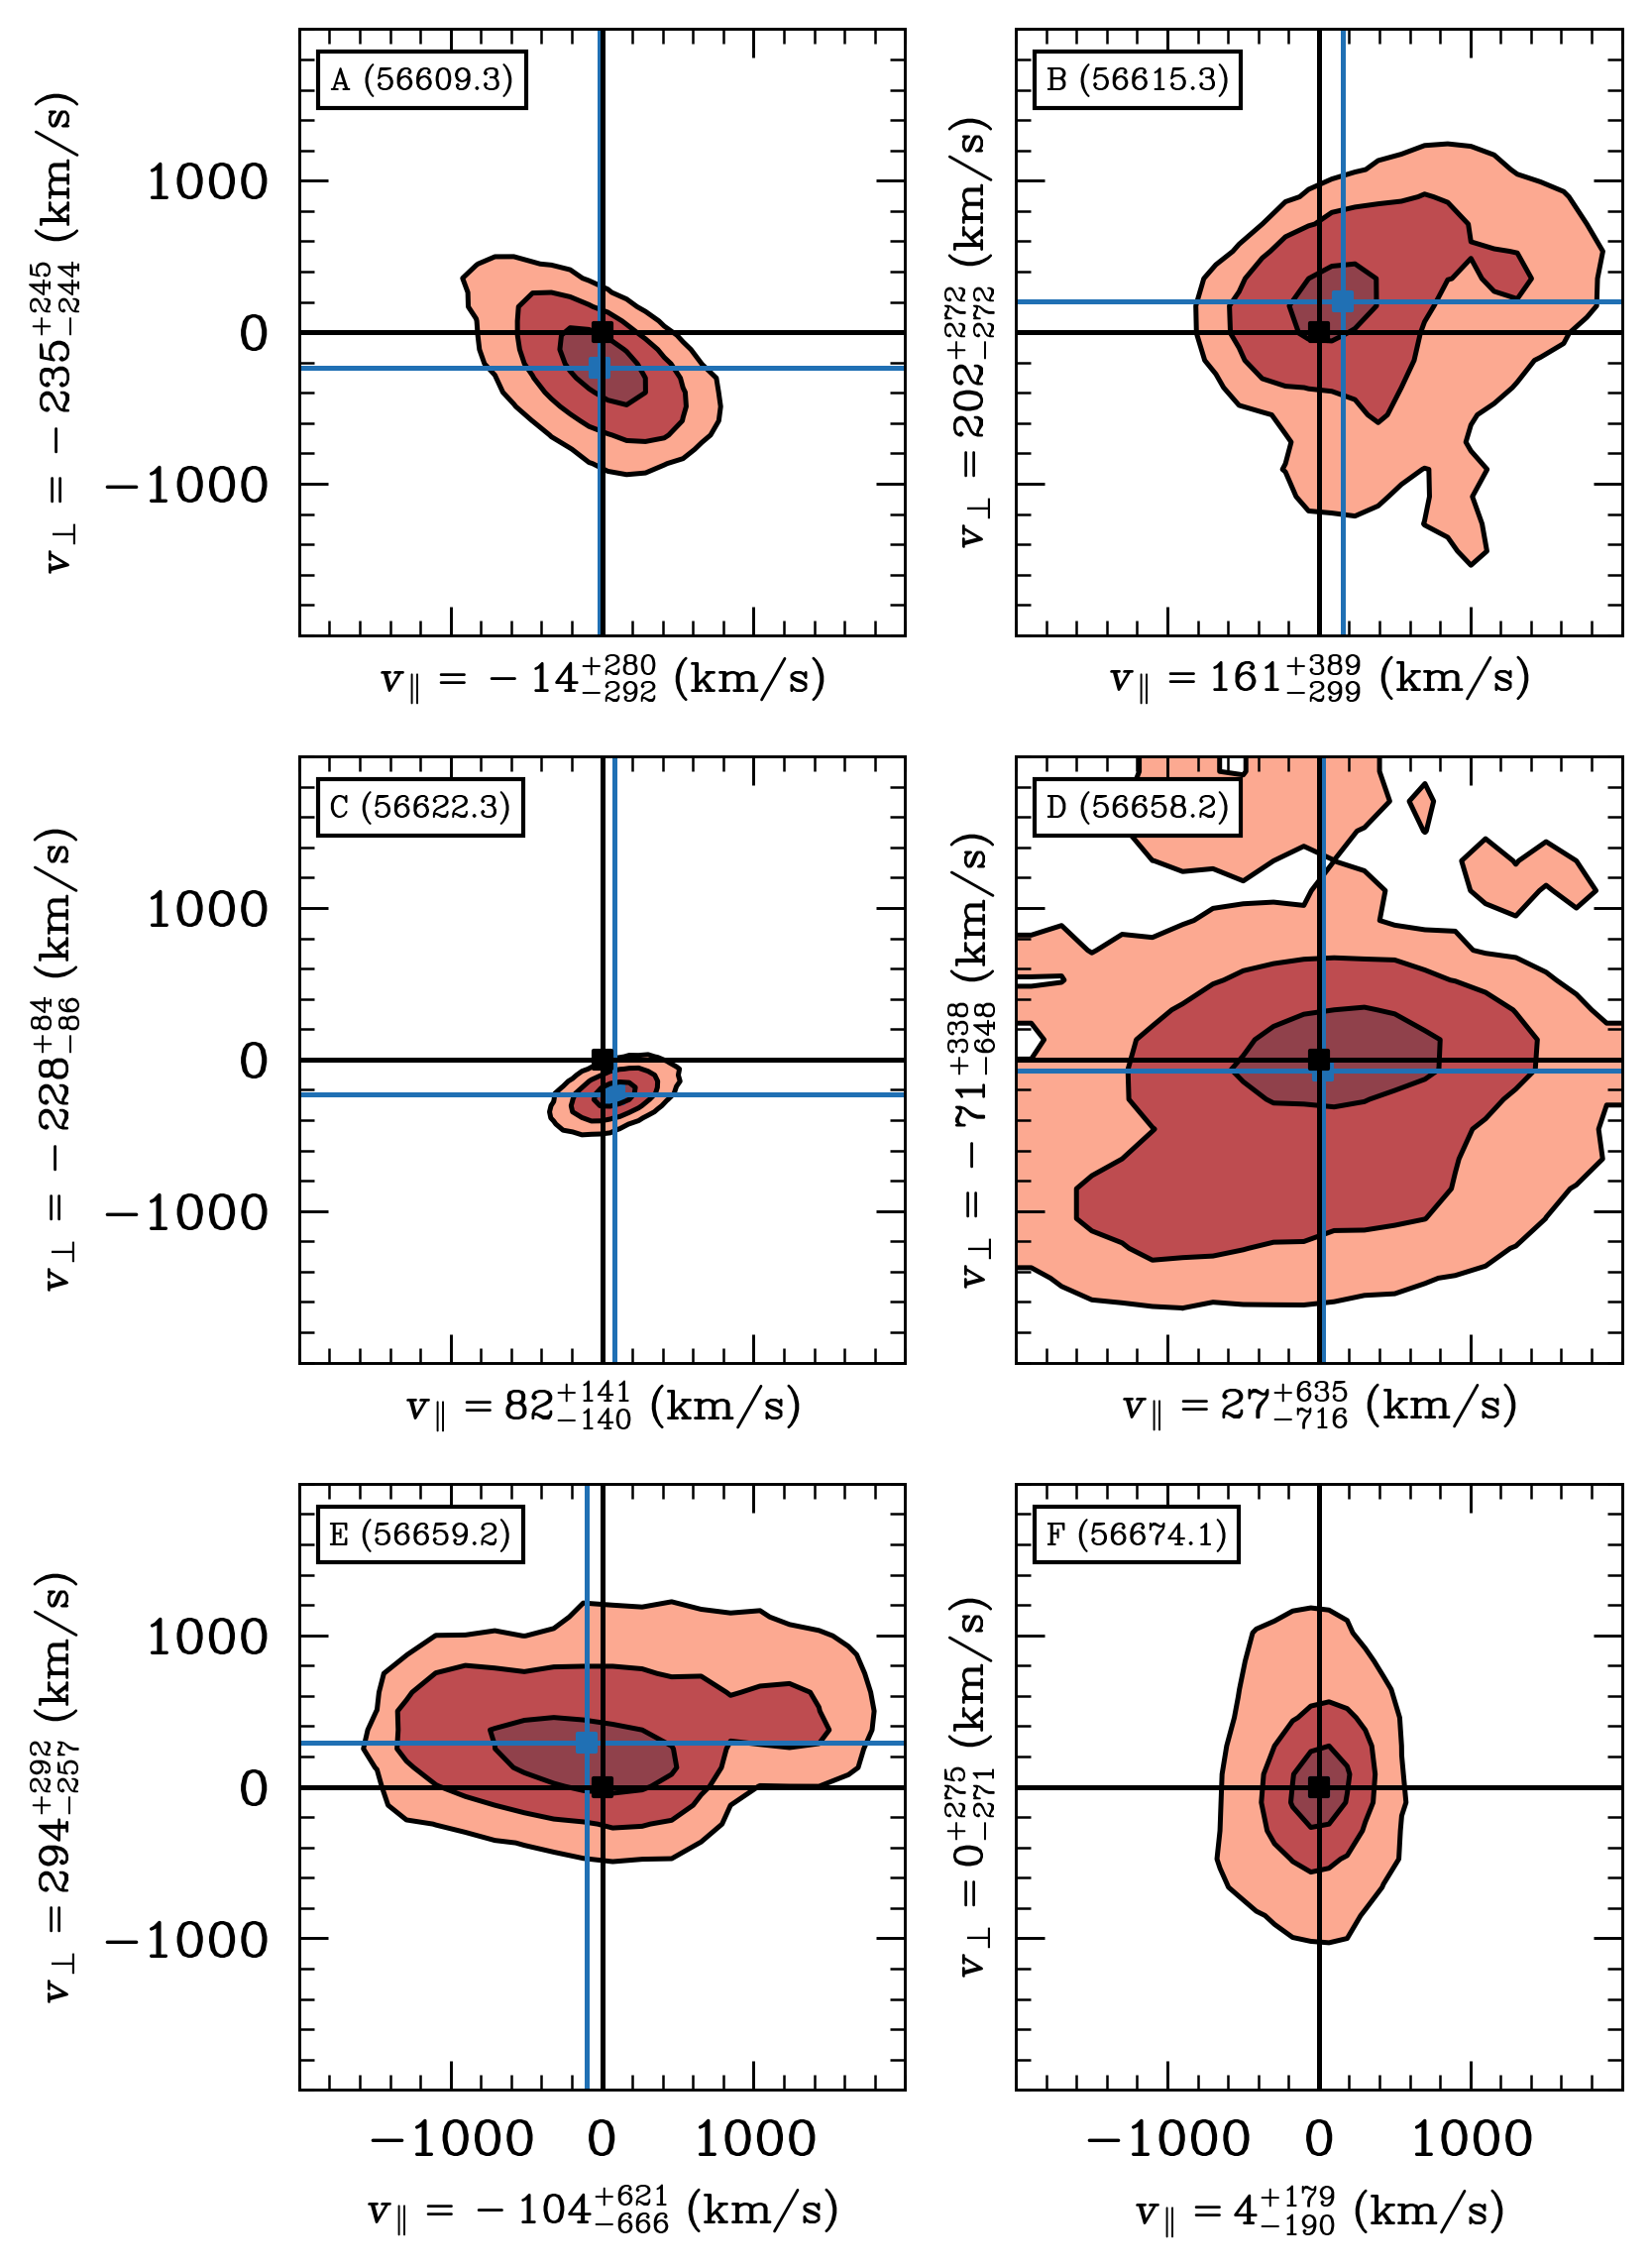
    corner.hist2d(
        x,
        y,
        levels=(0.393, 0.865, 0.989),
        ax=ax[i // 2, i % 2],
        plot_datapoints=False,
        plot_contours=True,
        fill_contours=True,
        contourf_kwargs={
            "colors": ("white", cmap(0.393), cmap(0.865), cmap(0.989)),
            "alpha": 0.75,
        },
    )

    ax[i // 2, i % 2].axvline(0, color="black", zorder=10)
    ax[i // 2, i % 2].axhline(0, color="black", zorder=10)
    ax[i // 2, i % 2].scatter([0], [0], marker="s", color="black", s=20, zorder=10)

    ax[i // 2, i % 2].axvline(x_per[1], color=mpl.cm.Blues(0.75))
    ax[i // 2, i % 2].axhline(y_per[1], color=mpl.cm.Blues(0.75))
    ax[i // 2, i % 2].scatter(
        [x_per[1]], [y_per[1]], marker="s", color=mpl.cm.Blues(0.75), s=20
    )

    ax[i // 2, i % 2].annotate(
        "%s (%.1f)" % (epoch, mean_mjd[i]),
        xy=(0.05, 0.9),
        xycoords="axes fraction",
        fontsize=9,
        bbox={"boxstyle": "square", "facecolor": "white", "edgecolor": "black"},
    )

    ax[i // 2, i % 2].set_xlabel(
        r"$v_{\parallel}=%2.0f^{+%2.0f}_{-%2.0f}$ (km/s)"
        % (x_per[1], x_per[2] - x_per[1], x_per[1] - x_per[0]),
        fontsize=12,
    )
    ax[i // 2, i % 2].set_ylabel(
        r"$v_{\perp}=%2.0f^{+%2.0f}_{-%2.0f}$ (km/s)"
        % (y_per[1], y_per[2] - y_per[1], y_per[1] - y_per[0]),
        fontsize=12,
    )

    ax[i // 2, i % 2].set_aspect("equal")
    ax[i // 2, i % 2].set_xticks(1000 * np.arange(-1, 2))
    ax[i // 2, i % 2].set_xticklabels(1000 * np.arange(-1, 2))
    ax[i // 2, i % 2].set_yticks(1000 * np.arange(-1, 2))
    ax[i // 2, i % 2].set_yticklabels(1000 * np.arange(-1, 2))

ax[0, 0].set_xlim(-2000, 2000)
ax[0, 0].set_ylim(-2000, 2000)
fig.set_facecolor("white")
fig.set_dpi(300)
plt.savefig(fig_path + "velocity_corner.pdf", bbox_inches="tight")
plt.show()

